Trong Writing Task 1, không phải bài nào cũng có các xu hướng tăng giảm. Đối với những bài không có trend, chúng ta chỉ có thể so sánh các số liệu với nhau.
Dưới đây là đề thi ngày 26/10/2013, ngày mà mình đi thi. Mình không nhớ được số liệu nên phải bịa vào, nội dung của bài là như sau:
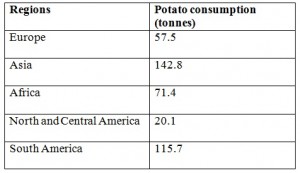
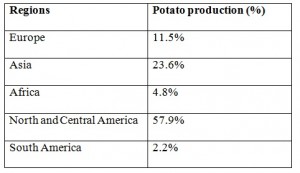
2 bảng đưa ra số liệu về việc sản xuất và tiêu dùng khoai tây ở 5 vùng năm 2006.
Bảng 1: Tiêu dùng khoai tây.
Bảng 2: Sản xuất khoai tây.
Vì có 2 bảng nên mình viết 2 đoạn body, mỗi đoạn về 1 bảng. Mình nhắc lại rằng, vì ở đây không có xu hướng, nên việc duy nhất chúng ta phải làm là so sánh 5 số liệu ở mỗi bảng với nhau.
Đoạn văn mẫu cho bảng 1:
In 2006, people in Asia consumed the highest amount of potato, at 142.8 tonnes. The figure for South America stood at 115.7 tonnes, while North and Central American diners only consumed the lowest quantity, at 20.1 tonnes. Meanwhile, 57.5 tonnes of potato was eaten by Europeans, compared to 71.4 tonnes by African individuals.
(53 words)
Các bạn thử dựa vào đoạn văn trên để viết đoạn thứ 2 cho bảng 2 nhé!


![[Phân tích] Vì sao bài viết đơn giản như vậy mà lại đạt điểm cao?](https://ielts-quangthang.com/wp-content/uploads/2019/12/task-2-computers-invention-150x150.jpg)


2 comments
The table compares five different global areas in terms of producing and consuming potatoes in 2006. It is clear from the tables that Asia was the region consuming the most number of potatoes, while North and Central Americans were the greatest consumers.
In 2006, the Asian accounted for the highest consumers for potatoes, at 142,8 tonnes, followed by the South America people at 115,7 tonnes, while North and Central American digested only the lowest quantity, at 20,1 tonnes. 71,4 tonnes of potatoes was eaten by Europeans, compared to 57,5 tonnes by African population.
Coming to the next table, North and Central America appeared to be the region which made the largest proportion of producing potatoes, while Africans and South Americans only produced the least percentage of 4,8% and 2,2%, respectively. Asians made up 23,6% in total, which was twice higher than Europeans did, at 11,5%.
Mình sắp thi IELTS, nhờ a Quang Thắng đóng góp ý kiên cho mình nhé. Thank a nhiều lắm